
Trade Idea: Best Buy


🏷️ Name: Best Buy
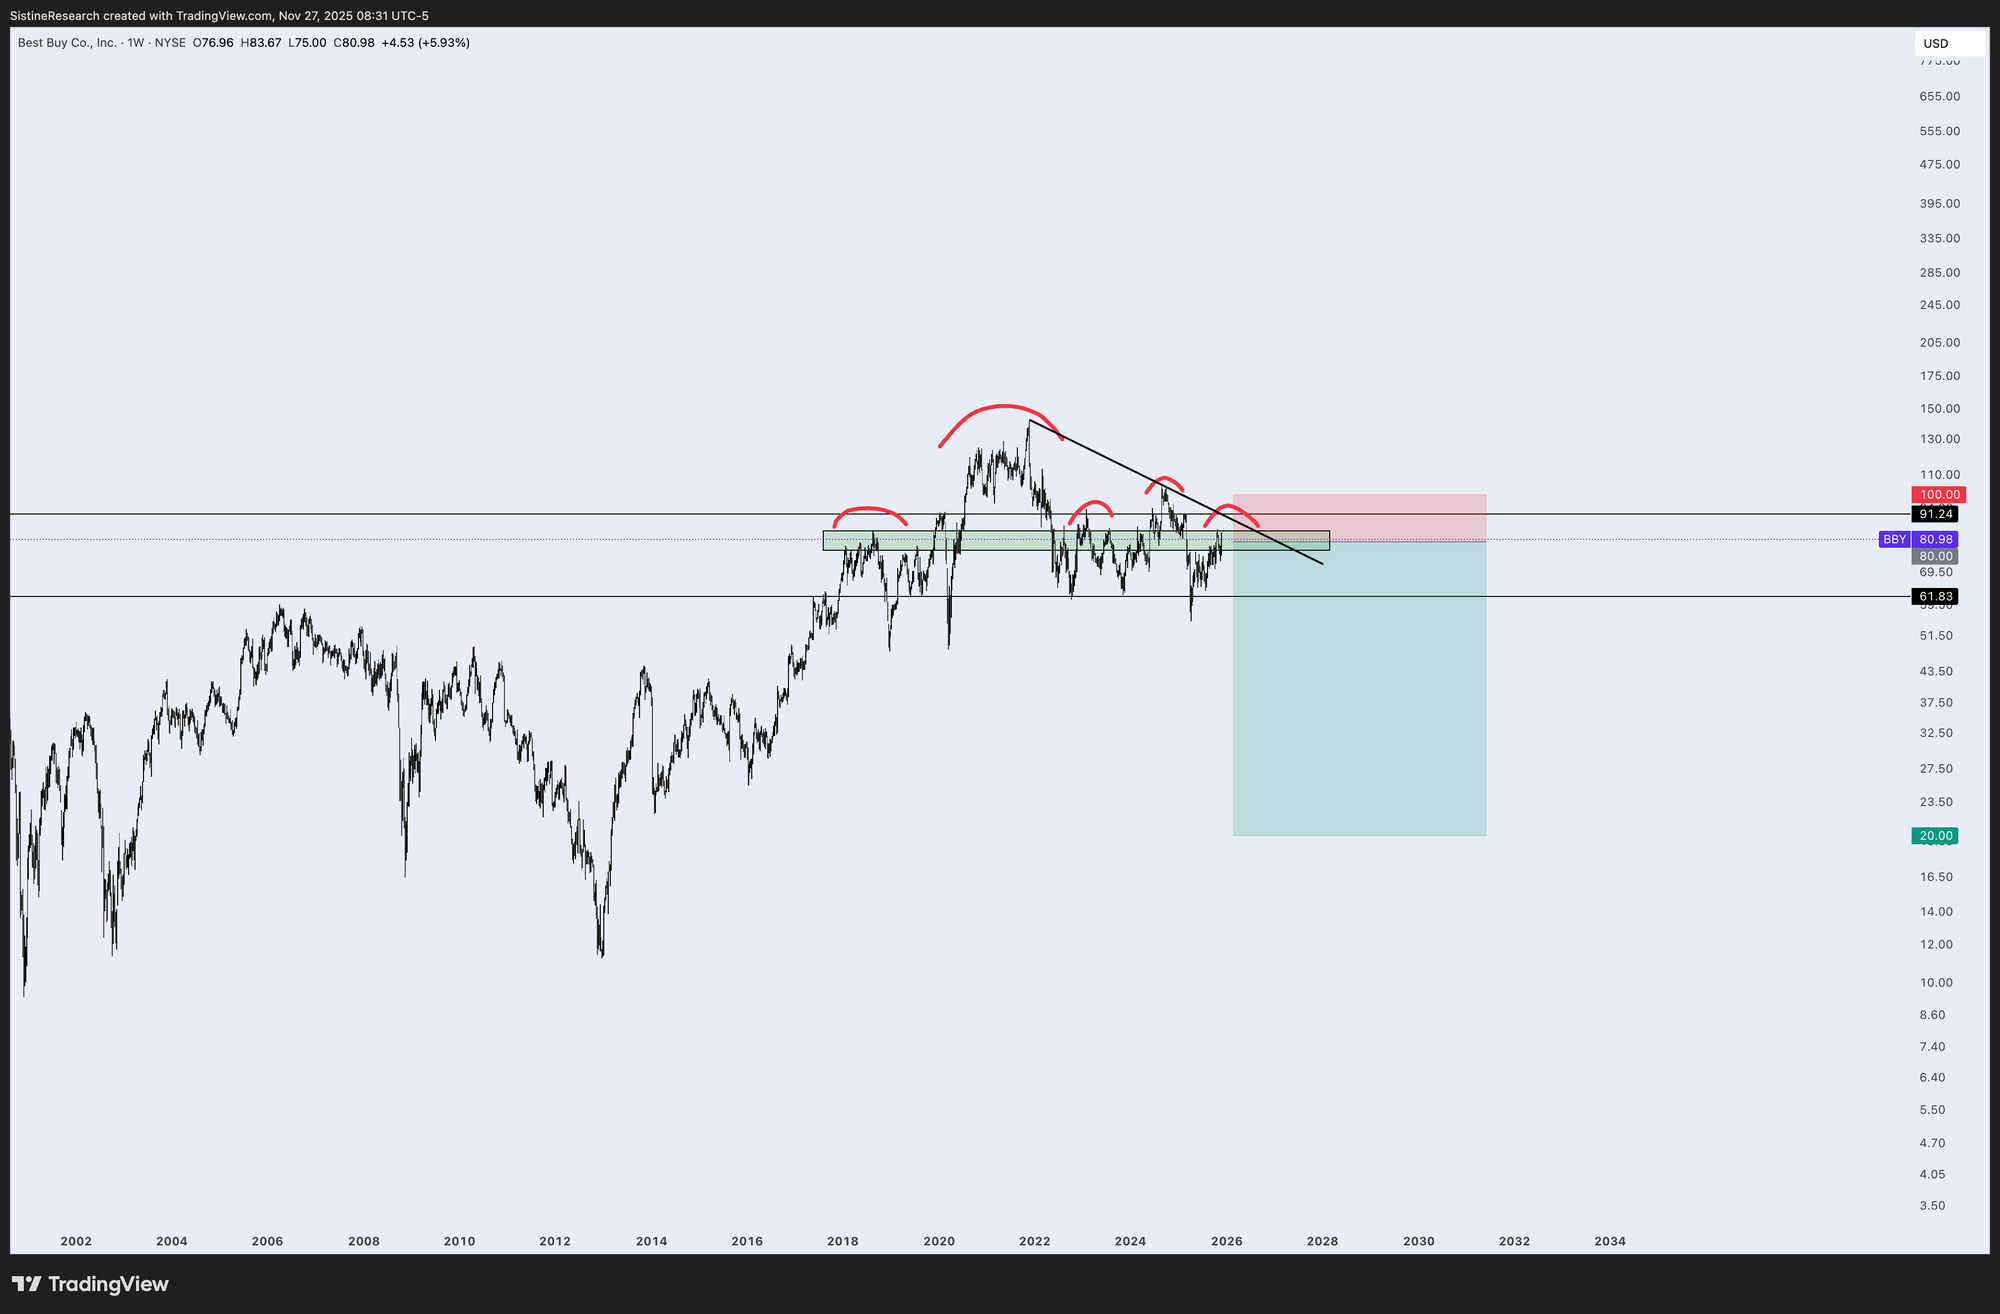
💠 Ticker: $BBY
📈 Direction: Short
🎯 Entry: >$80
🎯 Target: $20
🛑 Stop Loss: $100
⚖️ Risk / Reward: 3: 1
Executive Summary
Despite Best Buy's resilience as the last major standalone consumer electronics retailer, the company faces a convergence of structural and cyclical headwinds that severely limit its upside and expose significant downside risk. The short thesis is predicated on deteriorating organic growth (negative comparable sales), erosion of high-margin profit pools (specifically credit card profit-sharing), competitive disintermediation by vendors and e-commerce giants, and a massive vote of no confidence from insiders who have liquidated hundreds of millions in stock during recent rallies. With the stock trading at a premium valuation relative to its negative growth profile, BBY represents a compelling short opportunity.
1. Structural Growth Stagnation & Failed "Replacement Cycle"
The primary bull case for Best Buy—a robust "replacement cycle" following the COVID-19 tech boom—has failed to materialize in a way that offsets broader declines. Instead of growth, the company is managing a structural contraction.
- Persistent Negative Comps: In Q3 FY25 (reported Nov 2025), Best Buy reported a 2.9% decline in enterprise comparable sales, following a 6.9% decline in the same quarter the prior year.
- Guidance Cuts: Management lowered full-year FY25 revenue guidance to a range of $41.1 billion to $41.5 billion (down from $41.3B-$41.9B) and adjusted comparable sales guidance to a decline of 2.5% to 3.5%.
- Category Weakness: The declines are broad-based, with significant weakness in appliances (-15%), entertainment (-19%), and consumer electronics (-6%). This indicates that consumers are not merely delaying upgrades but are actively pulling back on discretionary big-ticket items due to macro uncertainty.
2. Erosion of High-Margin Profit Pools (Credit Card Impact)
A critical, often underappreciated driver of Best Buy's profitability—its co-branded credit card portfolio—is acting as a significant headwind rather than a tailwind. This high-margin revenue stream is deteriorating due to rising net charge-offs and modified profit-sharing terms.
- Profit-Sharing Decline: Multiple quarterly reports explicitly cite "lower profit-sharing revenue" from the company's private label and co-branded credit card arrangement as a primary drag on gross margins.
- Margin Impact: In Q3 FY25, while services helped margins, the lower credit card revenue partially offset these gains. As consumer credit stress rises, this previously reliable profit engine is becoming a liability, squeezing the net profit margin which has compressed from ~4.7% (FY22) to ~2.2% (FY25).
3. Insider Exodus: A "Vote of No Confidence"
Corporate insiders have engaged in aggressive selling throughout 2024 and 2025, taking advantage of share price strength to liquidate positions. This behavior suggests management sees limited upside at current valuations.
- Massive Liquidation by Chairman: Richard Schulze, Chairman Emeritus, sold approximately $154 million worth of stock in October 2025 alone, with massive block sales occurring between $80 and $84 per share.
- C-Suite Selling:
- CEO Corie Barry sold 79,829 shares in September 2024 for nearly $7.7 million.
- CFO Matthew Bilunas sold over $6 million in stock in December 2024 and continued selling in March 2025.
- One-Sided Activity: Over the last six months, there have been zero open market purchases by insiders, contrasted with 16 sales transactions.
4. Competitive Disintermediation & Market Share Loss
Best Buy is being squeezed from two sides: e-commerce giants taking general share, and major vendors (Apple, Microsoft) shifting to Direct-to-Consumer (DTC) models.
- Amazon Dominance: Amazon now holds a 27% to 28% market share in consumer electronics, rivaling Best Buy's 31% and overtaking it during Prime Day events. In the broader e-commerce market, Amazon commands nearly 38% share versus Best Buy's 1.2% - 1.4%.
- Vendor Disintermediation: Major suppliers are bypassing retail partners. Apple's services revenue alone has ballooned to over $100 billion, a high-margin stream that flows directly to Apple rather than through Best Buy's registers.
- Loss of "Destination" Status: Analysts note that Best Buy stores are becoming "showrooms of their own past," with traffic down 20% since 2022 as consumers hunt for bargains online or buy directly from brands.
5. Valuation Disconnect & Inventory Risks
Despite negative growth and shrinking margins, Best Buy trades at a premium to its historical averages, creating a "value trap" scenario.
- Premium Multiple: Best Buy currently trades at a P/E ratio of approximately 22x (as of Nov 2025), significantly higher than its 10-year historical average of ~14x. This expansion in multiple has occurred despite revenue declining from $51.7B in FY22 to ~$41.5B in FY25.
- Inventory Build: Inventory levels have risen to $5.8 billion (+1.9% Y/Y) even as sales decline, signaling potential future markdowns to clear slow-moving goods.
- Short Interest: Short interest remains moderate at roughly 6-8% of float with ~4 days to cover, indicating that while skepticism exists, the trade is not yet overcrowded, leaving room for price discovery to the downside.
Conclusion
Best Buy is fighting a war on multiple fronts: macro-economic pressure on discretionary spending, structural shifts to e-commerce/DTC, and internal erosion of key profit centers like credit cards. The disconnect between the company's shrinking fundamentals (negative comps, falling revenue) and its expanding valuation multiple (22x P/E) presents a clear asymmetry. Combined with aggressive insider liquidation, the setup favors a short position targeting a reversion to historical valuation norms.