
Trade Idea: GM vs Ford


🏷️ Name: General Motors + Ford
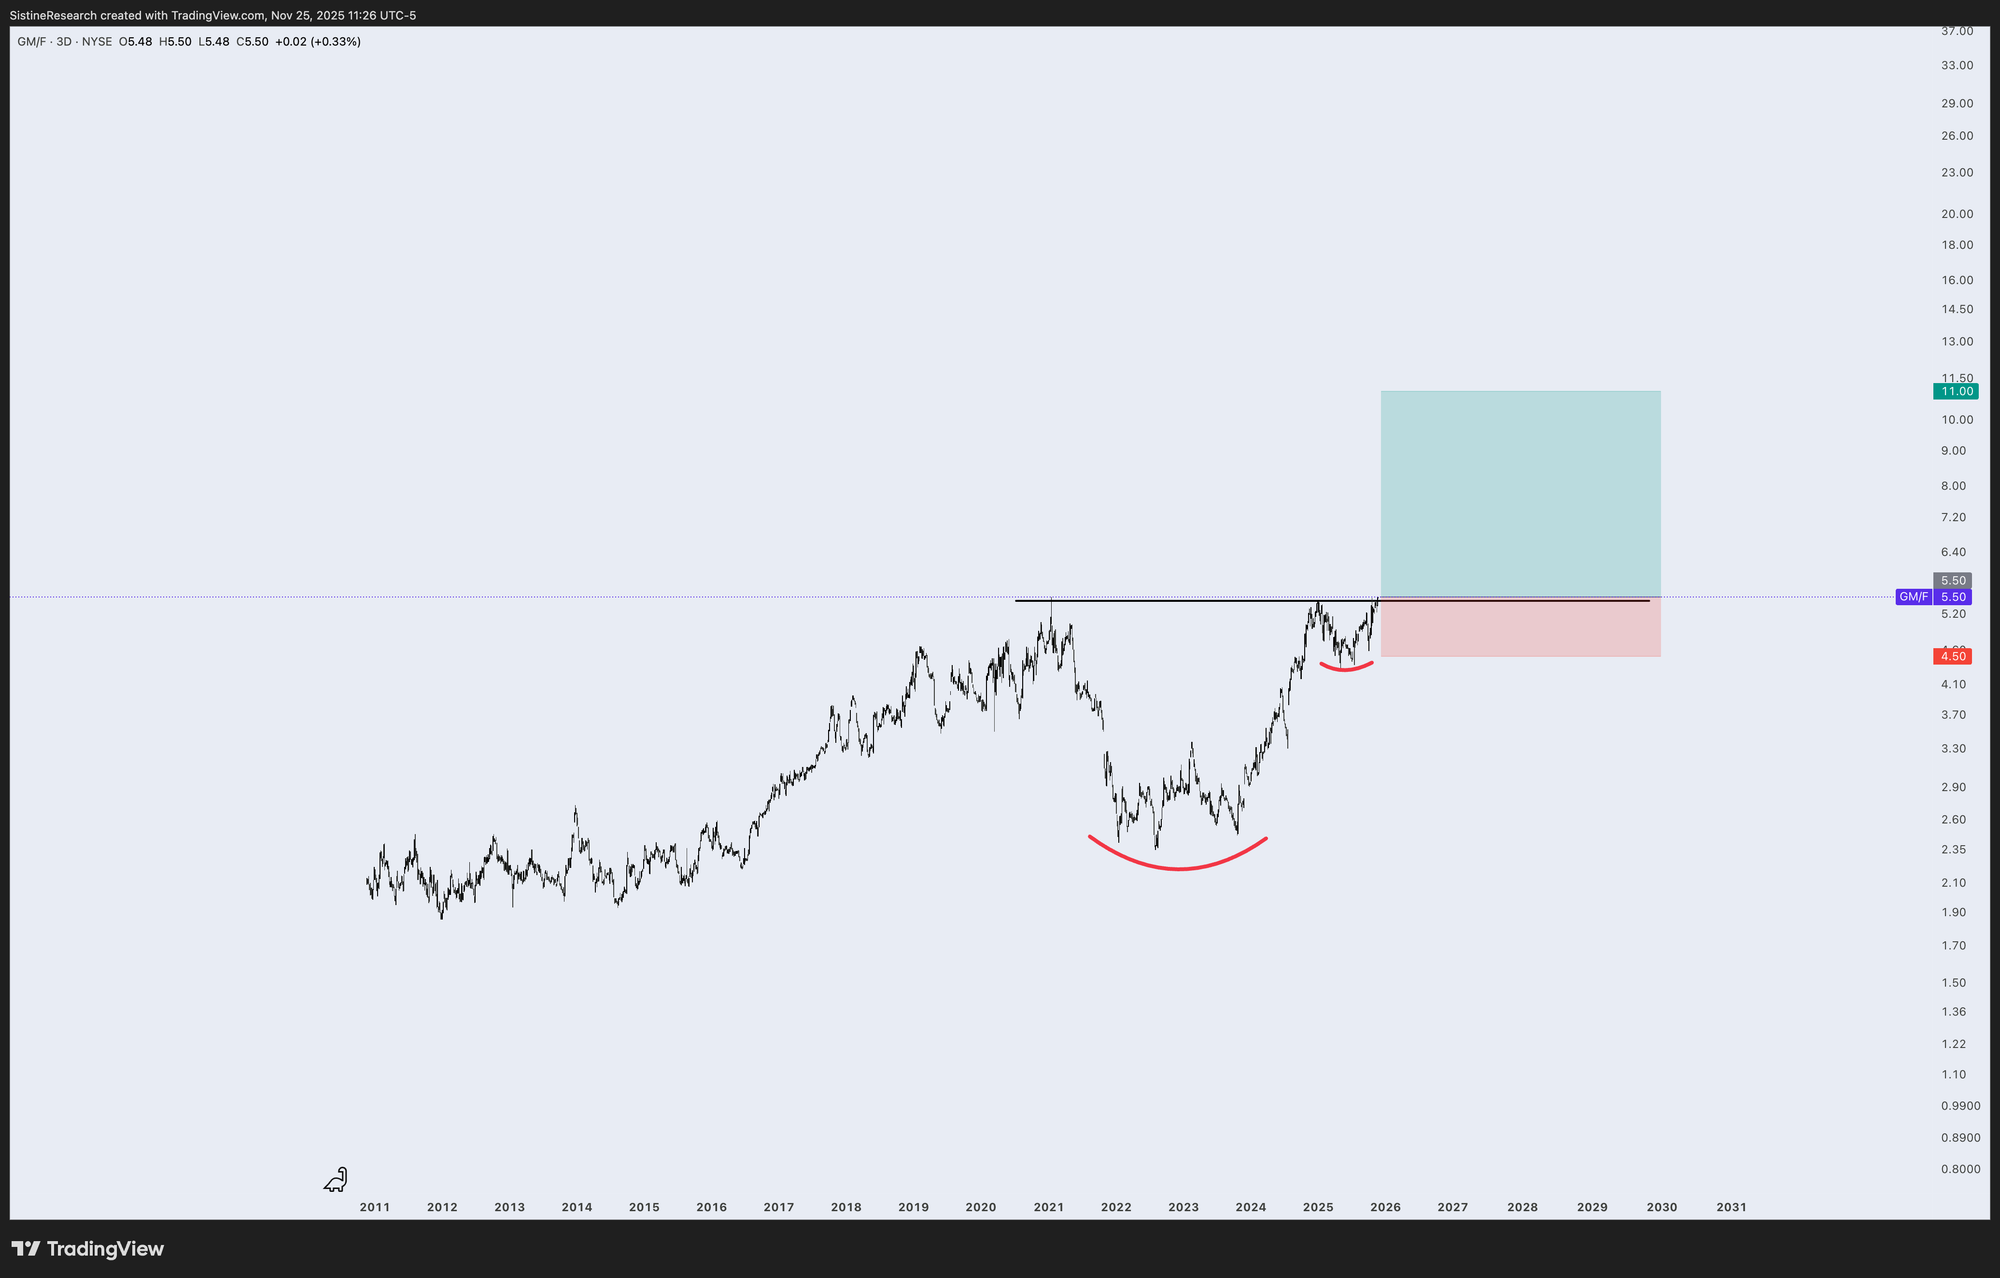
💠 Ticker: $GM + $F
📈 Direction: Long $GM, Short $F
🎯 Entry: Breakout above 5.5
🎯 Target: 11
🛑 Stop Loss: 4.5
⚖️ Risk / Reward: 5.5:1
Note: On pair trades make sure to chart the assets against each other (GM/F) to calculate the appropriate levels.
Equity Research: Long General Motors (GM) / Short Ford Motor Co. (F)
Date: November 24, 2025
Recommendation: LONG GM / SHORT F
Time Horizon: 12–18 Months
Executive Summary
A pair trade longing General Motors (GM) and shorting Ford Motor Co. (F) capitalizes on a widening divergence in operational efficiency, capital allocation efficacy, and electric vehicle (EV) execution. While both legacy automakers face similar macroeconomic headwinds—pricing normalization, high interest rates, and tariff uncertainty—GM demonstrates superior structural profitability and a more robust balance sheet.
The core thesis rests on three pillars:
- Operational Quality & Margins: GM’s North American margins consistently outperform Ford’s, which are eroded by an industry-leading warranty and recall burden (projected ~$5 billion impact in 2025).
- EV Profitability Inflection: GM has guided to variable profit positive EVs in Q4 2024/2025, whereas Ford’s Model e division projects losses of ~$5–$5.5 billion through 2025.
- Shareholder Yield: GM’s aggressive share repurchase program ($10B accelerated + $6B authorization) offers a higher yield and tangible support for EPS growth compared to Ford’s dividend-focused strategy.
1. Fundamental Divergence: Margins & Segment Performance
GM’s streamlined operations generate superior returns on capital compared to Ford’s complex "three-business" structure, where the highly profitable Ford Pro unit is actively subsidizing massive losses in Model e.
General Motors: Disciplined Profitability
GM's North American (GMNA) EBIT-adjusted margins remain robust, consistently tracking in the 8-10% range excluding one-off impacts. In 2024, GM reported full-year adjusted EBIT of $14.9 billion with an EPS of $10.60.
- Truck Dominance: GM’s full-size truck and SUV franchise (Chevrolet Silverado, GMC Sierra) continues to drive over 40% of U.S. sales volume.
- EV Economics: GM expects EV losses to shrink by ~$2–4 billion in 2025 as it scales the Ultium platform, achieving variable profit positivity.
Ford: A Tale of Three Cities
Ford’s segmentation reveals the extent of its cross-subsidization problem. While Ford Pro is an absolute powerhouse, Model e burns cash at an alarming rate.
- Ford Pro (Commercial): The "crown jewel," generating ~$2.3 billion EBIT in Q2 2025 with a 12.3% margin.
- Ford Blue (ICE): Margins have compressed to ~2.6–5.5% (Q2/Q3 2025) due to higher warranty costs and manufacturing inefficiencies.
- Ford Model e (EV): Reported a staggering EBIT loss of $1.2–$1.4 billion per quarter in 2025, with margins as low as -104% to -79%.
Trade Implication: GM’s consolidated margin profile is cleaner and less reliant on a single business unit to offset multibillion-dollar drags.
2. The "Quality Tax": Warranty & Recall Costs
Ford currently suffers from a systemic quality disadvantage that acts as a direct tax on earnings and valuation.
- Recall Volume: Ford led the U.S. industry with 104 recalls in the first half of 2025 alone, affecting over 4 million vehicles.
- Financial Impact: Ford’s warranty costs surged to roughly 4% of sales in Q2 2024—double the historical norm and significantly higher than GM’s ~2.4%.
- Specific Charges:
- $570 Million: Q2 2025 charge for fuel injector leaks in Bronco Sport/Escape models.
- $165 Million: Civil penalty from NHTSA for delayed rearview camera recalls.
Comparison: While GM faces its own issues (e.g., 600k vehicle engine recall in 2025 costing ~$500M+), its overall warranty accrual rate is structurally lower, preserving free cash flow (FCF).
3. Capital Allocation: Buybacks vs. Dividends
The divergence in shareholder return strategies favors GM in the current environment.
- General Motors: Executed a massive $10 billion accelerated share repurchase (ASR) in late 2023/2024 and authorized a new $6 billion program in June 2024, retiring nearly 18% of shares outstanding. This artificially boosts EPS and creates a persistent bid for the stock.
- Ford: Relies on a high dividend yield (~5.8%) and special dividends. While attractive to income investors, the dividend is less flexible than buybacks and is under pressure from the ~$5 billion annual EV losses and warranty costs. The Ford family’s Class B share structure creates a bias toward dividends over buybacks, limiting the company's ability to retire undervalued equity.
4. Valuation & Consensus Estimates
Despite GM’s superior execution, it trades at a discount or parity to Ford on key multiples, offering a "value arbitrage" opportunity.
| Metric | General Motors (GM) | Ford (F) | Analysis |
|---|---|---|---|
| Forward P/E | ~5.5x – 6.3x | ~9.0x – 9.7x | GM trades at a significant discount despite higher quality earnings. |
| EV / EBITDA | ~7.8x - 8.1x | ~10.8x - 12.0x | Market assigns a lower multiple to GM’s EBITDA, creating upside if the valuation gap narrows. |
| FCF Yield | ~13.8% | ~12.2% | GM generates superior free cash flow relative to its market cap. |
| 2025 EPS Est. | $9.75 – $10.50 | $1.04 – $1.40 | GM earnings power is ~8-9x higher per share, driven by share count reduction. |
Analyst Consensus:
- GM: "Buy" consensus (29 Buys, 15 Holds). Price targets raised recently to $85–$92 range.
- Ford: "Hold" consensus (24 Holds). Price targets hovering ~$11–12, indicating limited upside.
5. Risks to the Trade
While the setup is compelling, specific risks must be managed:
- Ford Pro Spin-off Speculation: Any move to spin off the high-margin Ford Pro unit could unlock massive value for Ford shareholders, blowing up the short leg.
- Tariffs & Trade War: Both companies face headwinds from potential 25% tariffs on Mexican/Canadian imports. Bernstein estimates such tariffs could wipe out ~65% of GM's FCF, potentially hitting GM harder given its specific footprint.
- Macro Volatility: In past crises (e.g., 2020), GM has shown significantly higher volatility (3-4x Ford’s) and steeper drawdowns, meaning a broad market crash could hurt the long GM leg disproportionately.
Conclusion
Long GM / Short Ford is a trade on execution vs. inefficiency. GM has successfully navigated its post-bankruptcy restructuring to become a disciplined, cash-generating machine that aggressively returns capital to shareholders. Ford, while owning the premier commercial franchise in Ford Pro, is weighed down by operational ineptitude (recalls) and an unchecked cash burn in EVs.
Entry Strategy: Initiate at current levels (GM ~$70, F ~$12.80) targeting a 15-20% spread convergence over 12 months.
Catalysts: GM Q4 2025 earnings confirming EV profitability; Ford FY 2025 guidance validating continued warranty drags and Model e losses.
*Not financial advice.