Trade Idea: Silver

🏷️ Name: Silver
💠 Ticker: $SLV
📈 Direction: Long
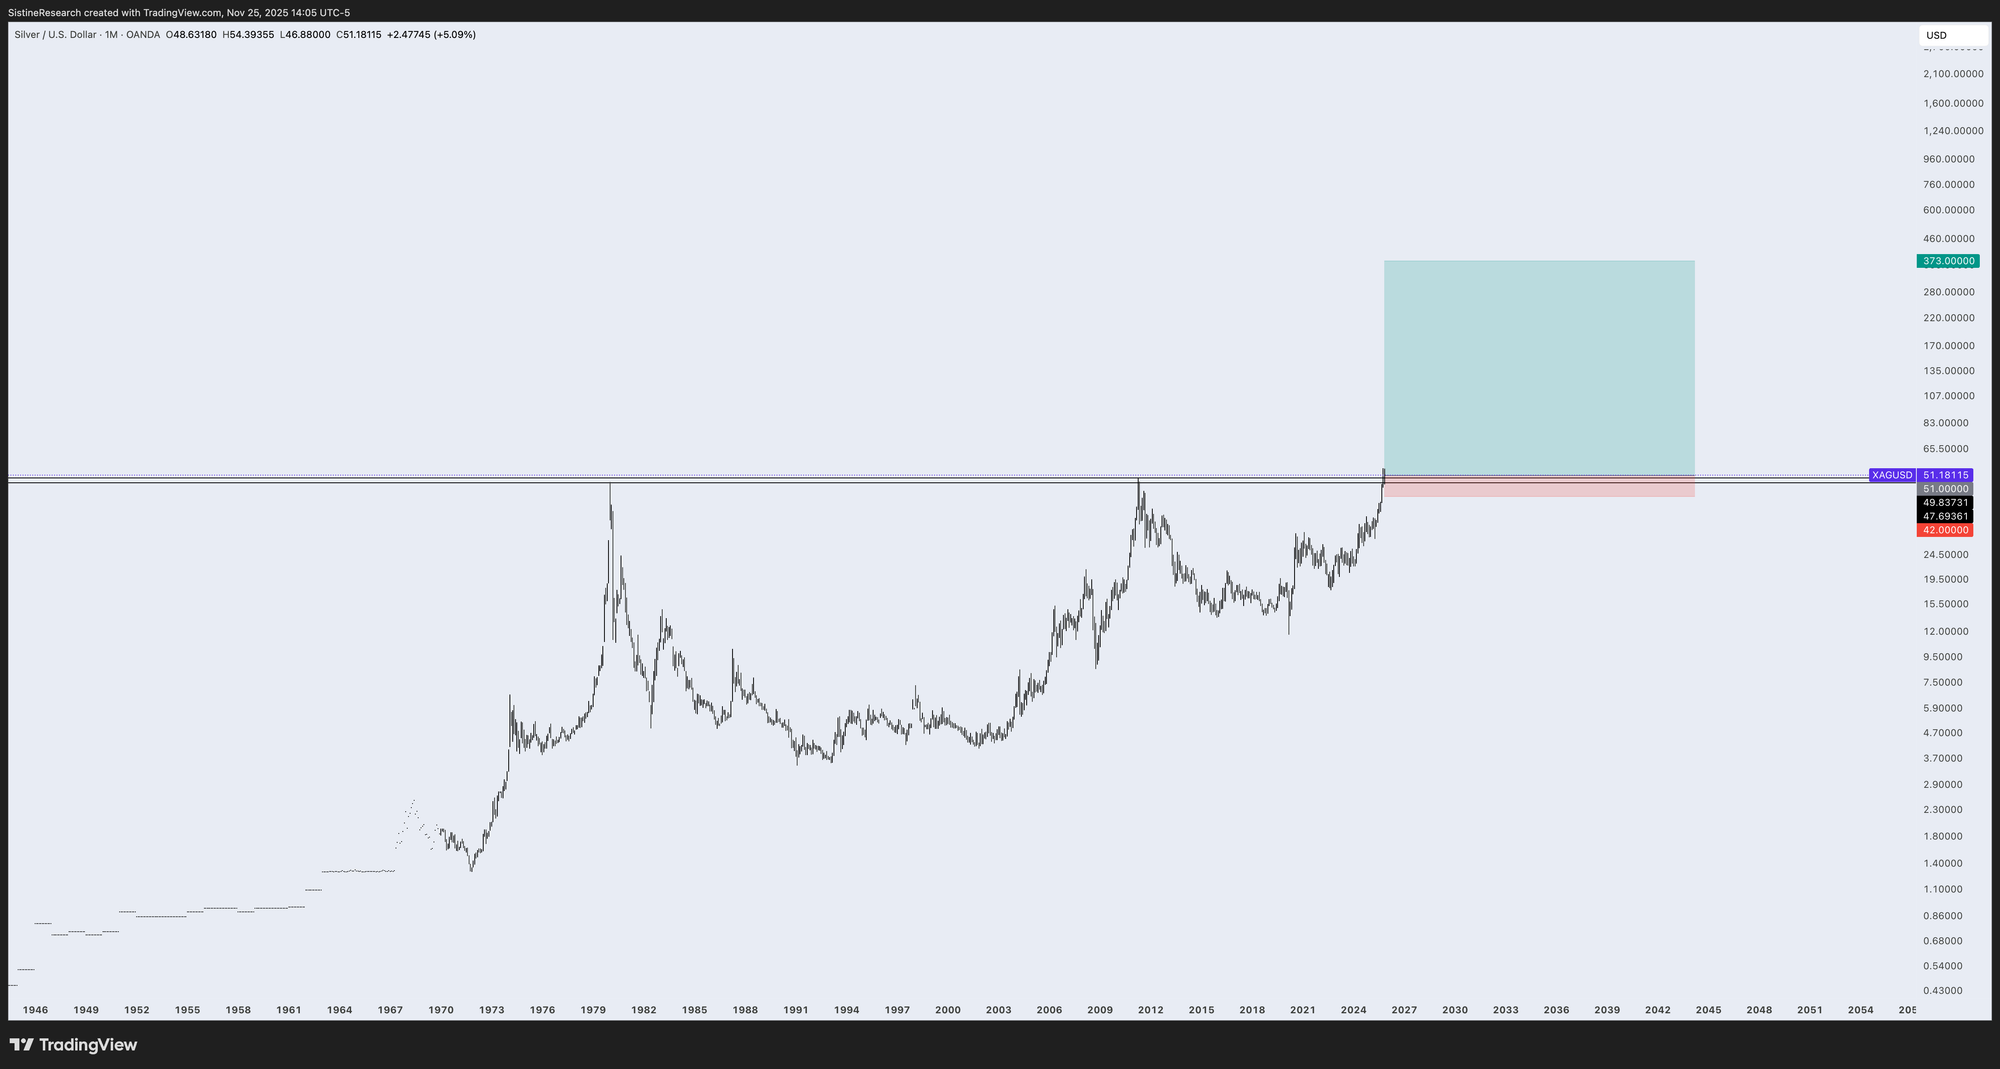
🎯 Entry: Breakout over $50
🎯 Target: $373 or trailing stop
🛑 Stop Loss: $42
⚖️ Risk / Reward: 36: 1
Silver is holding above the 50 year cup and handle neckline attempting to confirm a breakout.
The Case for $300+ Silver
The thesis for silver reaching $300 per ounce rests on a convergence of three structural drivers: the reversion of inflation-adjusted valuations to historical peaks, a persistent and widening physical supply deficit driven by industrial decarbonization, and a statistical mean reversion in the gold-to-silver ratio. While a price of $300 represents a roughly 600% increase from recent trading levels (approx. $50), analysis suggests this figure is not a speculative outlier but rather a return to historical purchasing power parity.
1. Inflation-Adjusted Valuation Models
The primary argument for $300+ silver is that the metal remains historically undervalued when adjusted for monetary debasement. While the nominal all-time highs of 1980 and 2011 are roughly $50 per ounce, these figures fail to account for decades of purchasing power loss.
- Official CPI Adjustment: Even using government-sanctioned Consumer Price Index (CPI) data, the 1980 peak of $50 adjusts to approximately $140–$160 in today's currency. This implies that merely matching its previous real valuation would require a triple-digit price.
- ShadowStats Alternative Adjustment: When applying the 1980 CPI methodology (before methodological changes reduced reported inflation), the divergence is extreme. Data provided by ShadowStats indicates the 1980 silver peak is equivalent to roughly $966–$1,000 per ounce in today's terms.
- The $300 Target: Analysts using these adjusted models view $300 not as a new high, but as a conservative midpoint between the official CPI-adjusted peak (~$150) and the ShadowStats peak (~$1,000). For instance, independent analysis suggests that if silver matched its 1980 purchasing power parity, a target of $606 would be justifiable, making $300 a "Best Buy" level by comparison.
2. Structural Supply-Demand Deficit (The "Physical Squeeze")
Unlike previous bull markets driven largely by investment demand, the current thesis is underpinned by an inelastic industrial floor. The market is entering a permanent deficit phase where consumption exceeds mine output.
Expanding Industrial Deficits
- Consecutive Shortfalls: The silver market is on track for its fifth consecutive year of structural deficit in 2025. The cumulative shortfall from 2021 to 2025 exceeds 796 million ounces, effectively erasing nearly a full year of global mine production.
- Solar Photovoltaic (PV) Acceleration: The solar sector has become the dominant driver, with demand jumping from under 60 million ounces in 2014 to over 230 million ounces in 2024. New "TOPCon" and Heterojunction (HJT) cell technologies require significantly more silver per unit—up to 50% more than previous generations.
- Future Projections: Research indicates that by 2030, the solar industry alone could consume 29–41% of global silver supply, or up to 450 million ounces annually.
Inelastic Supply
- Byproduct Constraints: Approximately 70–72% of silver is mined as a byproduct of lead, zinc, copper, and gold. Consequently, primary silver supply cannot react quickly to price spikes; miners will not increase copper production solely to extract more silver.
- Declining Output: Global mine production has remained stagnant or declined slightly since 2016, creating a widening gap between fixed supply and exponential green-energy demand.
3. Monetary Mean Reversion: Gold-to-Silver Ratio (GSR)
Technical analysts argue that $300 silver is a mathematical inevitability if the Gold-to-Silver Ratio (GSR) reverts to its historical mean during a gold bull market.
- Ratio Mechanics: The GSR currently trades near 80–85:1, well above the 20th-century average of roughly 50:1 and the geologically natural ratio of roughly 15:1.
- The $300 Calculation:
- Base Case: If gold rises to $5,000 and the GSR compresses to 15:1 (matching the 1980 low), the implied silver price is $333 per ounce ($5,000 ÷ 15).
- Mania Phase: In a scenario where gold reaches $10,000 due to currency debasement, even a conservative GSR of 30:1 would result in $333 silver. Historical precedent shows the ratio can fall as low as 17:1 or even 15:1 during peak bull markets.
4. Analyst & Expert Price Targets
Prominent sector analysts have explicitly modeled scenarios where silver exceeds $300:
- Peter Krauth (Silver Stock Investor): Projects a potential peak of $300 based on the "Gold $5,000 / GSR 15" model. He validates this by cross-referencing inflation-adjusted highs which suggest a "real" value between $240 and $360.
- PricePrediction.net (AI Model): Utilizes deep learning algorithms to forecast an average price of $337.82 by 2030, driven by the depletion of reserves and industrial necessity.
- Keith Neumeyer (First Majestic Silver): Argues that silver is a strategic metal that should uncouple from gold. He notes that with mining ratios at 7:1 (silver to gold) and price ratios at 90:1, the market is severely mispricing the metal relative to its rarity.
- Mike Maloney (GoldSilver.com): Suggests that in a "mania phase," $300 is "quite achievable" and aligns with historical ratio compressions.
Summary of Catalysts
| Driver | Metric | Impact on $300 Thesis |
|---|---|---|
| Inflation | 1980 High (ShadowStats) ≈ $1,000 | Establishes $300 as historically "cheap." |
| Supply | Cumulative Deficit >796M oz | Creates physical scarcity, forcing price discovery. |
| Solar Demand | 450M oz/year by 2030 | Consumes nearly 50% of supply, removing it from investment pools. |
| Monetary Ratio | GSR Reversion to 15:1 | mathematically implies $333 silver at $5k Gold. |
The convergence of record industrial demand, depleted above-ground inventories, and the historical tendency for the Gold-to-Silver ratio to snap back from extremes supports a long-term valuation target of $300 per ounce.