Chart Patterns
Find formations such as SVFs, Gartleys, triangles, and head-and-shoulders. See the boundaries and whether a setup is forming, confirmed, or failed.
 Sistine
YOUR MARKET RESEARCH WORKSPACE
Spot chart patterns, compare historical paths, and follow market strength. Turn a market full of noise into a shortlist worth researching.
Web + Mac included · No free trial · Cancel renewals anytime
Already subscribed? Open the web app →
Coming from X? Open in Safari or Chrome before you pay.
SEE IT IN ACTION
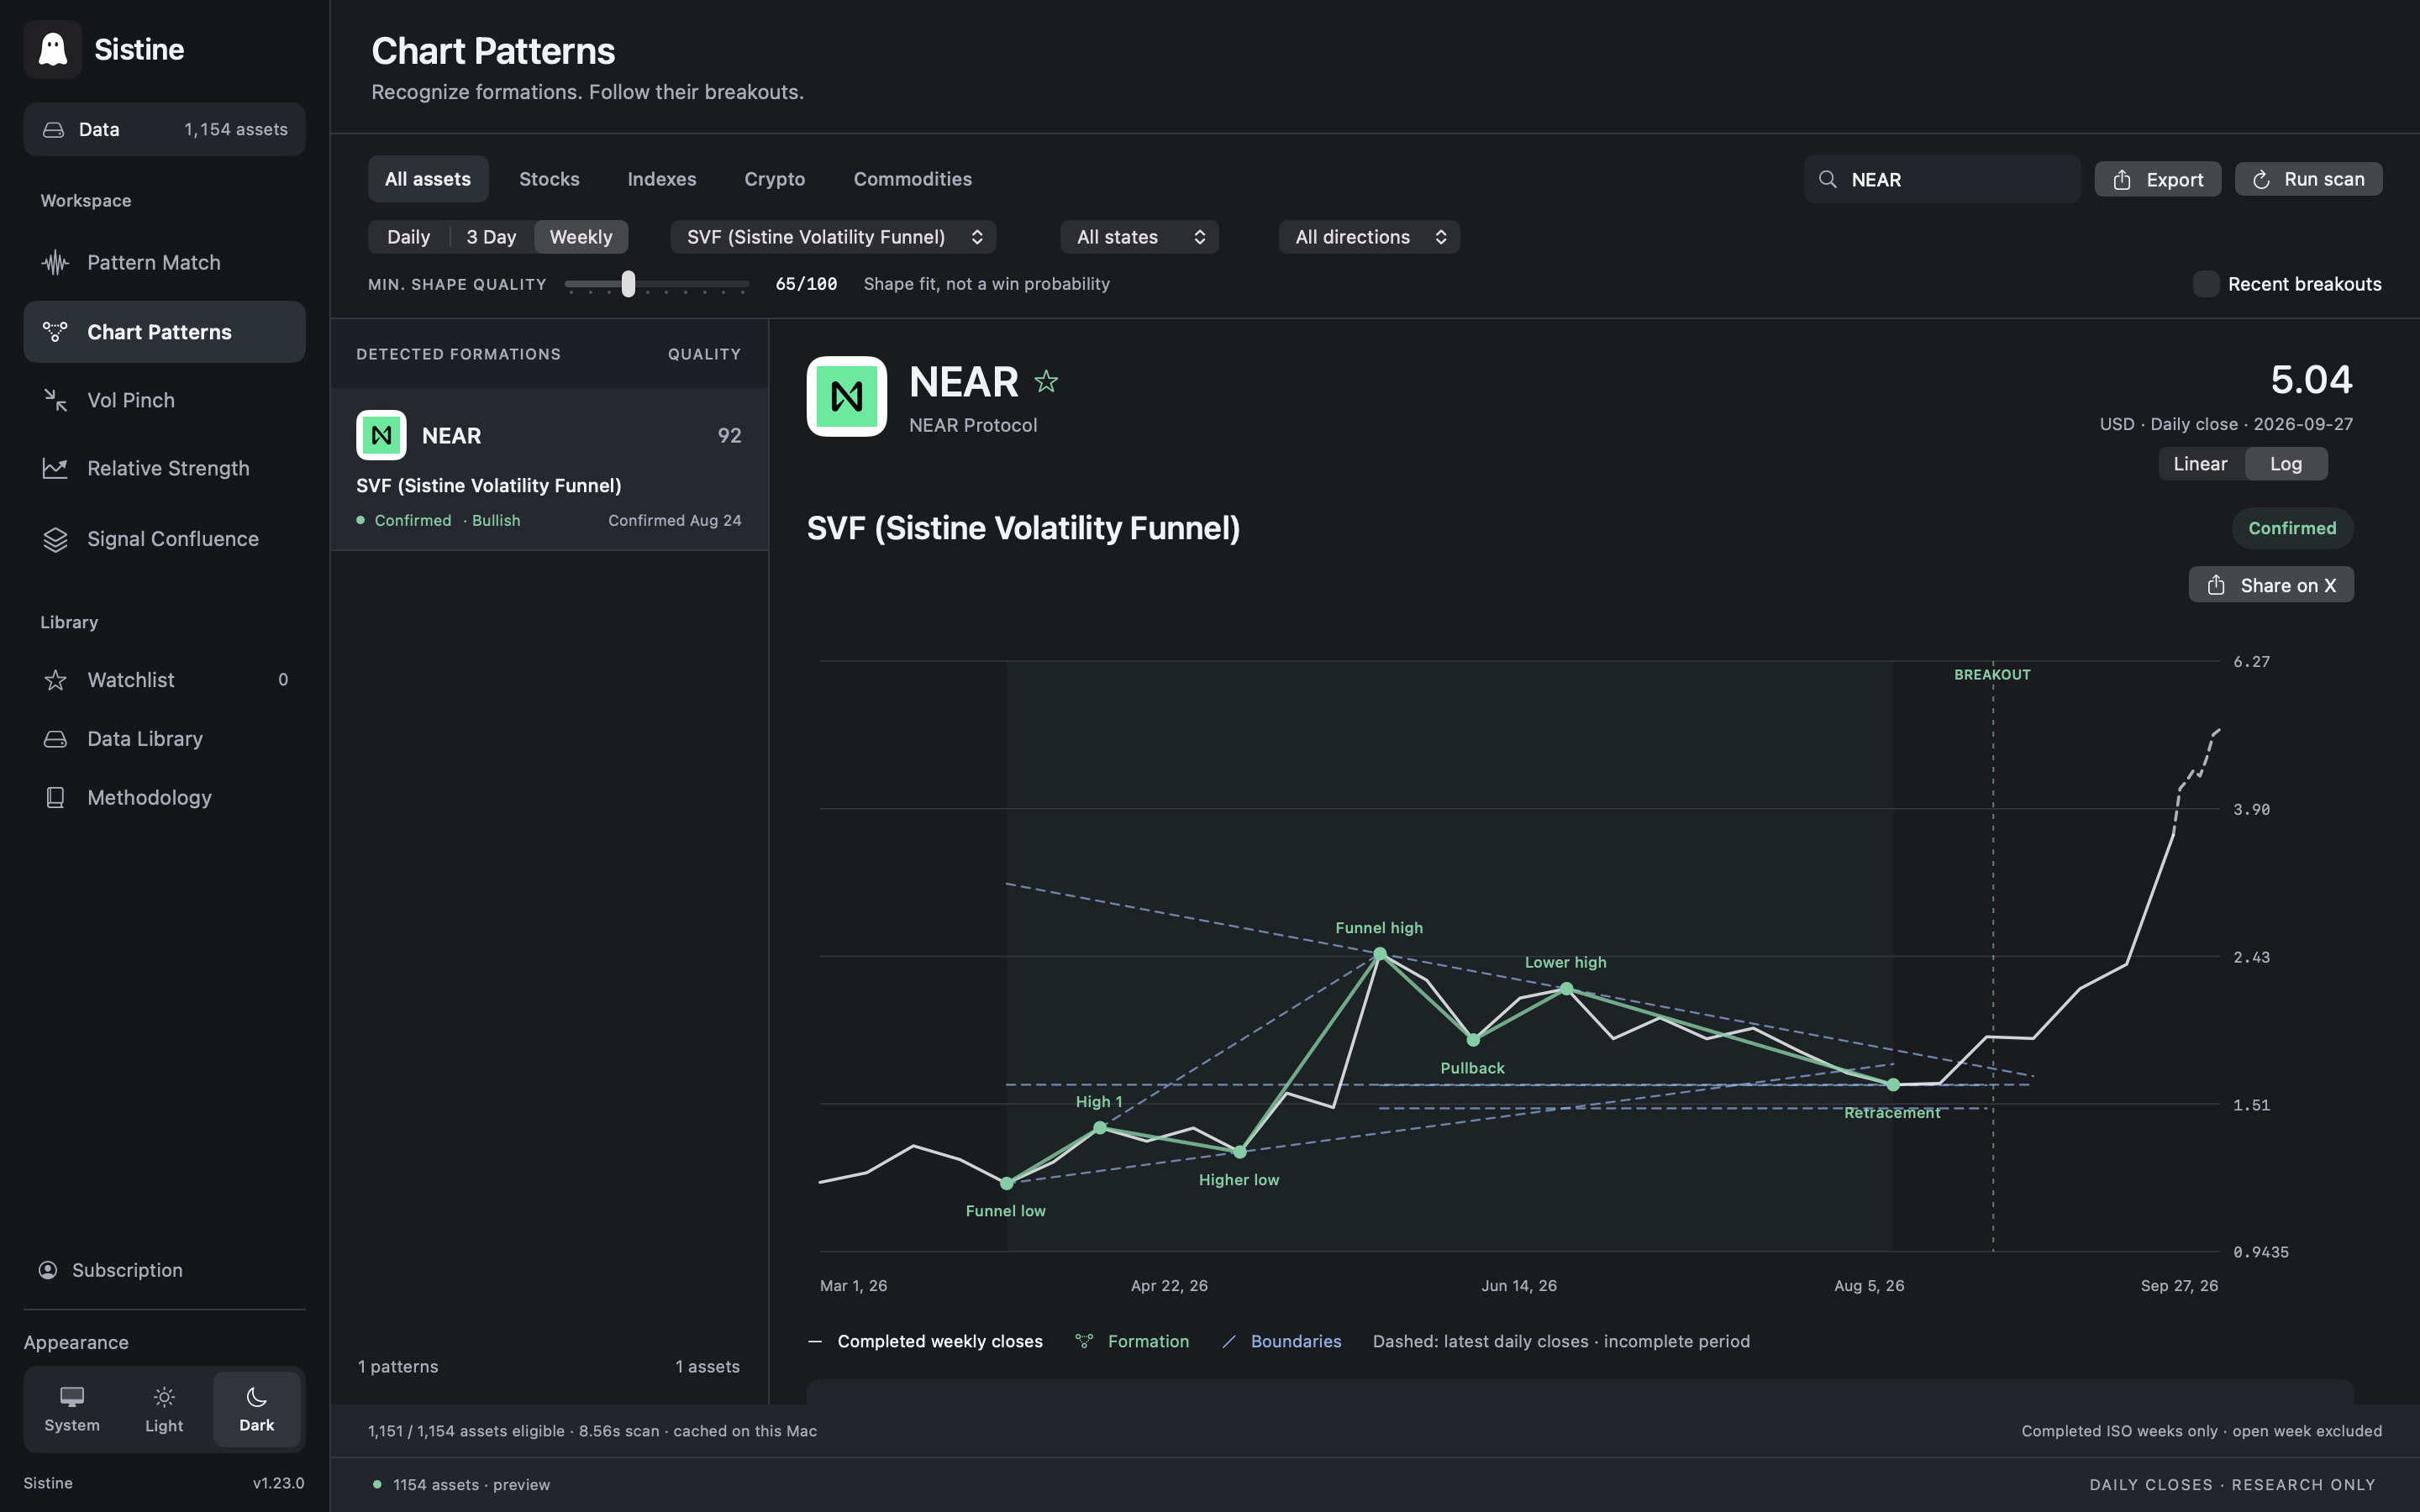
NEAR formed a Sistine Volatility Funnel: a widening upward formation, a pullback, then a break above the downtrend. Here is what the app shows.
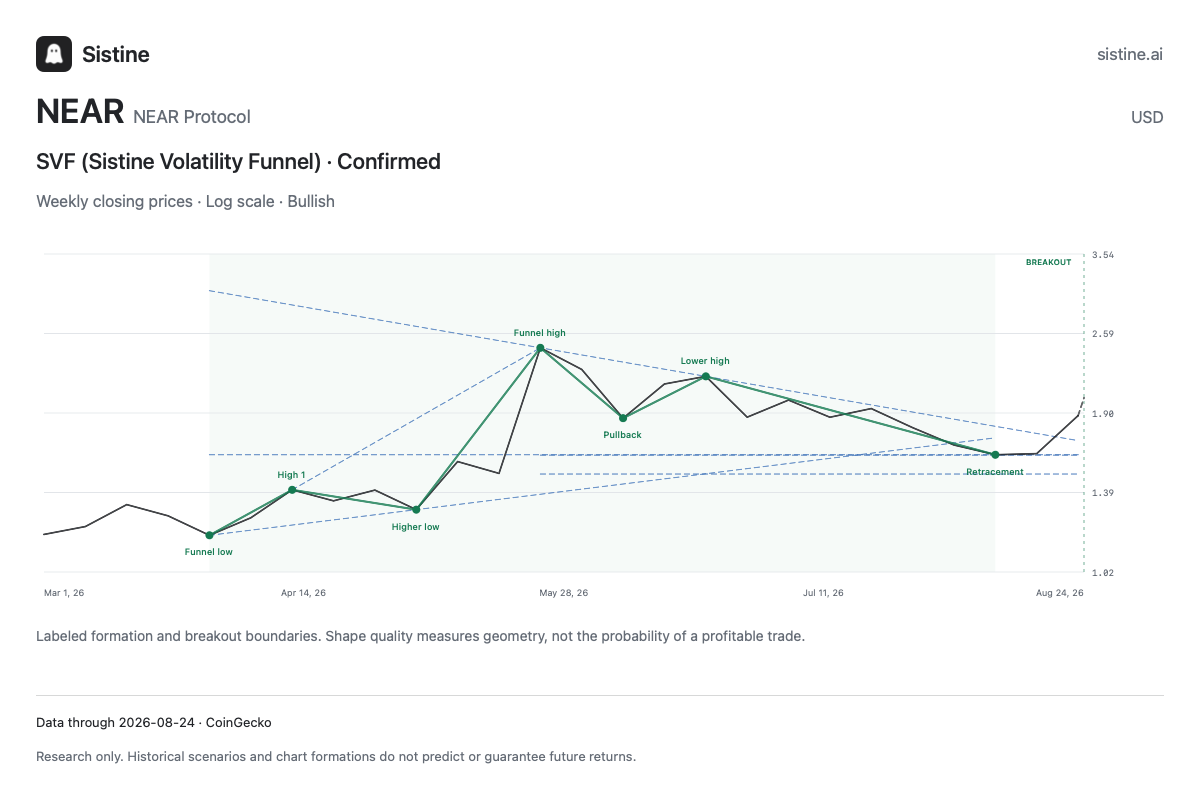
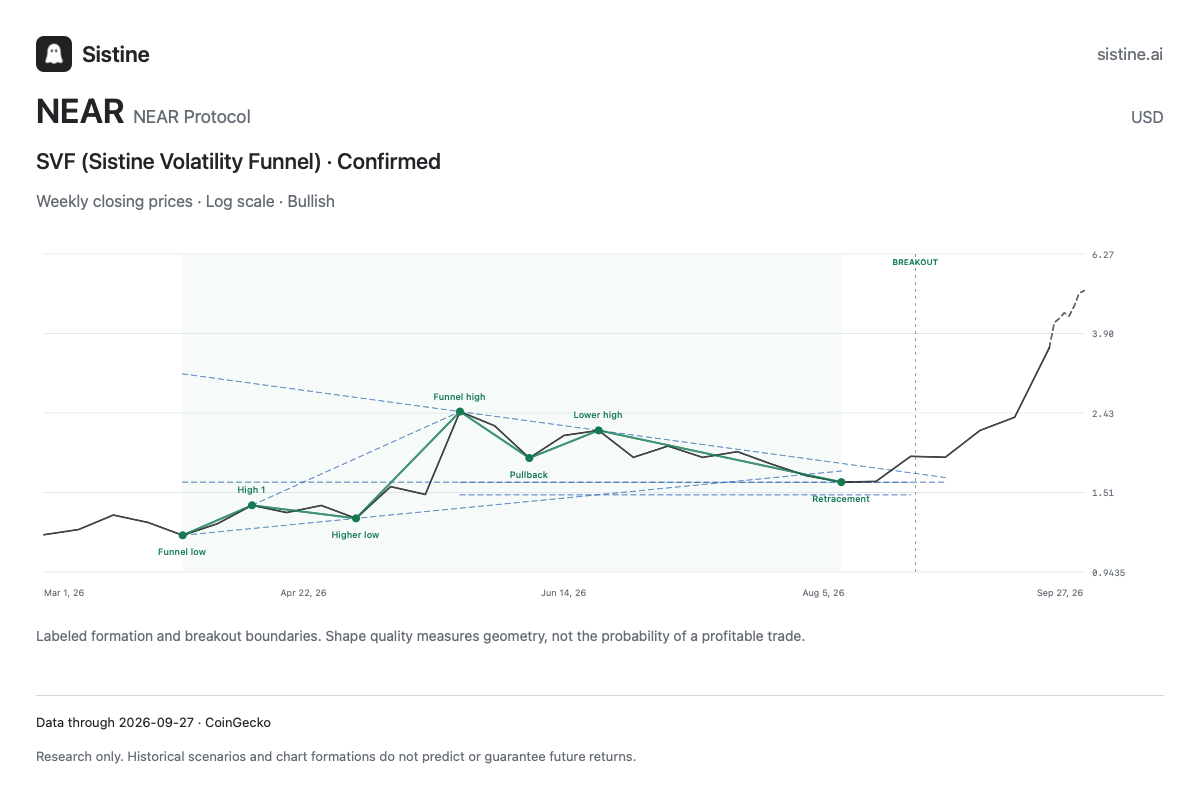
Selected historical example, reproduced with the current detector, not a claim that an alert was sent at the time. +168.1% compares the $1.87846 weekly close with the later $5.03581 snapshot; it is a price change, not an achievable trade return. Setups can fail. This example does not establish typical results. Data: CoinGecko.
Start for $9 a monthA BETTER RESEARCH ROUTINE
Use each view on its own, or bring the evidence together.
Find formations such as SVFs, Gartleys, triangles, and head-and-shoulders. See the boundaries and whether a setup is forming, confirmed, or failed.
Compare the five closest historical shapes and the paths that followed. Explore a range of scenarios, with more weight on closer matches.
Find the assets leading or lagging the market. Track who is climbing the rankings over a day, week, or month.
Surface unusually quiet periods by comparing each asset’s current volatility with its own history.
Find $250k–$50m coins on Solana, Base and Robinhood Chain. Look for steady accumulation, higher lows and bullish breakouts, with market cap and pool liquidity shown separately.
See where multiple tools agree. Combine formations, historical scenarios, volatility, and relative strength to prioritize your research.
Find clusters of momentum, stretch, exhaustion and reversal evidence. Compare eleven methods on Daily, Weekly and Monthly observations, with available methods and price-confirmation stages shown separately.
SIMPLE BY DESIGN
Move between the browser and your Mac with one subscription.
SISTINE
$9USD / month
All seven tools. Web + one Mac.
Billed monthly. No free trial. US customers only.
Add Telegram alerts for $12/month total →
Web + Mac + alerts. Just $3 more than the core plan.
Use Safari or Chrome for checkout, not an in-app browser. Keep using your purchase browser. Private windows, clearing site data, or browser storage cleanup can remove access. Lost access? We can help.
Mac app: macOS 14+ on Apple silicon. Download for Mac · about 21 MB.On your Mac, visit sistine.ai/download. Already subscribed? Open Sistine →
GOOD TO KNOW
Sistine helps you research possibilities. Pattern Match shows historical scenarios, while Chart Patterns identifies price formations. Neither establishes a probability of profit or guarantees a future price.
Shared imports run daily. Stocks, indexes and commodity futures update after completed trading days; crypto updates every day. Each asset displays its last available data date. Onchain Coins uses separate hourly pool scans with 1-hour and 4-hour charts. Coverage is a rotating shortlist, with freshness shown in the app; these are research snapshots, not live quotes.
Yes. The web app runs in your browser on a phone or computer. The native app requires macOS 14 or later on Apple silicon. Windows users can use the web version.
Open Subscription in the app or web version to manage billing. Canceling stops future renewals and keeps access through the paid period. If you lose your purchase browser, contact support@sistine.ai for help restoring access. Paid periods are not refunded except as described in our cancellation and refund policy.
CHOOSE YOUR RESEARCH WORKFLOW
Explore all seven research views, learn how the chart-pattern scanner works, or compare Sistine with TradingView, TrendSpider and Finviz.
Web + Mac · $9/month · Cancel renewals anytime
Already subscribed? Open Sistine →Allow X to measure visits and purchases from our ads? X may use cookies and device information. Your choice does not affect your subscription. Details