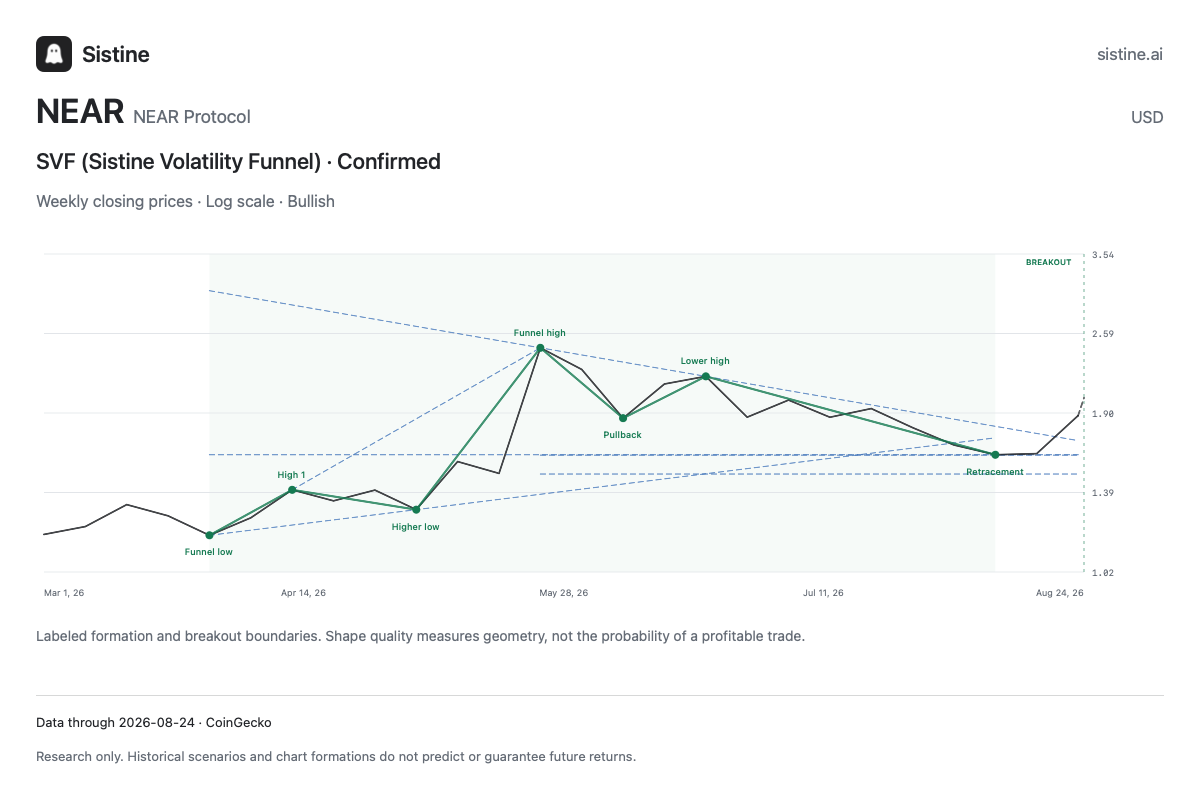
Find formations across a market universe, then inspect their boundaries and confirmation state in the actual chart.
By the Sistine team · Updated October 20, 2026
Sistine’s Chart Patterns screen identifies defined formations in supported price histories. It brings a market-wide candidate list and an annotated chart into one workspace, with Daily, 3 Day and Weekly choices.
What does a pattern scanner do?
A scanner applies the same geometric rules to many charts. Instead of opening every asset manually, you begin with the assets whose structure meets those rules. Sistine shows formations including its Sistine Volatility Funnel (SVF), Gartleys, triangles and head-and-shoulders. A detected pattern still needs context: its age, confirmation state, the asset’s trend and current business or project evidence.
Formation, confirmation and historical similarity
Chart Patterns: defined structure
Inspect the actual boundaries and labeled observations. A forming pattern has not met its confirmation condition. A confirmed state describes an observed rule being satisfied, not a guaranteed subsequent move. A completed Gartley is not automatically a breakout.
Pattern Match: comparable shapes
This separate tab finds five similar historical paths and shows what followed them. It helps explore scenarios without claiming that a named formation or a close historical match predicts a particular outcome.
How to research a scanner result
Select a timeframe and inspect the asset’s latest data date.
Read the plotted boundaries and confirmation state. Do not substitute an isolated chart high for the scanner’s actual boundary.
Check Relative Strength, Vol Pinch and Pattern Match for supporting or conflicting observations.
Read primary company or project information before treating price structure as a research thesis.
Save the asset to a watchlist and revisit the setup after new completed observations.
Historical interface example reproduced with the current detector. It does not establish that an alert was delivered at the time or demonstrate typical performance.
When this workflow fits
Sistine suits researchers who want predefined screens and historical context across several asset classes. If you need extensively customized charts or an intraday trading workstation, compare the available controls and data before subscribing. See Sistine versus TradingView and Sistine versus TrendSpider.
Common questions
Is pattern recognition the same as a buy signal?
No. A pattern describes observed price structure. It does not establish an investment’s value, account for your circumstances or guarantee what follows.
Can I screen crypto as well as stocks?
Yes. The core research universe includes supported stocks, crypto, indexes and commodity futures. Eligibility depends on the available history and data quality; it is not every tradable instrument.
Does the scanner execute trades?
No. Sistine is research software. The optional Telegram plan delivers alerts; it does not place orders.
Build a shortlist worth researching.
Sistine combines seven research views in your browser and on Mac. The core plan is $9 USD per month; web, Mac and Telegram alerts together cost $12 per month total.