1. Chart Patterns
Which assets have recognizable price structure? Inspect formations such as SVFs, triangles, Gartleys and head-and-shoulders, with visible boundaries and forming, confirmed or failed states.
Market research guide
Sistine is market-research software for people who want a focused shortlist of price setups across stocks, crypto, indexes and commodity futures. It runs in a web browser and as a native Mac app.
What is Sistine? A $9/month research workspace that brings chart formations, comparable historical paths, relative strength, volatility compression and turning-point evidence together. It does not place trades or promise investment outcomes.
Which assets have recognizable price structure? Inspect formations such as SVFs, triangles, Gartleys and head-and-shoulders, with visible boundaries and forming, confirmed or failed states.
What followed similar shapes in market history? Compare an asset with its five closest historical shapes and inspect the subsequent paths. Similarity is a way to explore scenarios; it does not make those paths forecasts.
Which assets are leading or lagging? Compare returns and changes in rank across the supported universe, then inspect the underlying chart. This cross-asset ranking is different from the RSI oscillator.
Where has price become unusually quiet? Compare current volatility with each asset’s own history. A low percentile highlights compression; it does not identify which direction price will move.
Which eligible small tokens have structure worth investigating? Review price action, participation, market capitalization and pool liquidity. The separate hourly discovery scan covers Solana, Base and Robinhood Chain with 1-hour and 4-hour charts. Coverage is a rotating shortlist.
Where do the tools agree, and where do they conflict? Inspect Pattern Match, Chart Patterns, Relative Strength and Vol Pinch together. An active neutral-compression signal is not another bullish vote.
Which assets have clusters of stretched momentum, price extension, exhaustion or reversal structure? Select Daily, Weekly or Monthly observations and inspect up to eleven methods, their availability and their shared signal families.
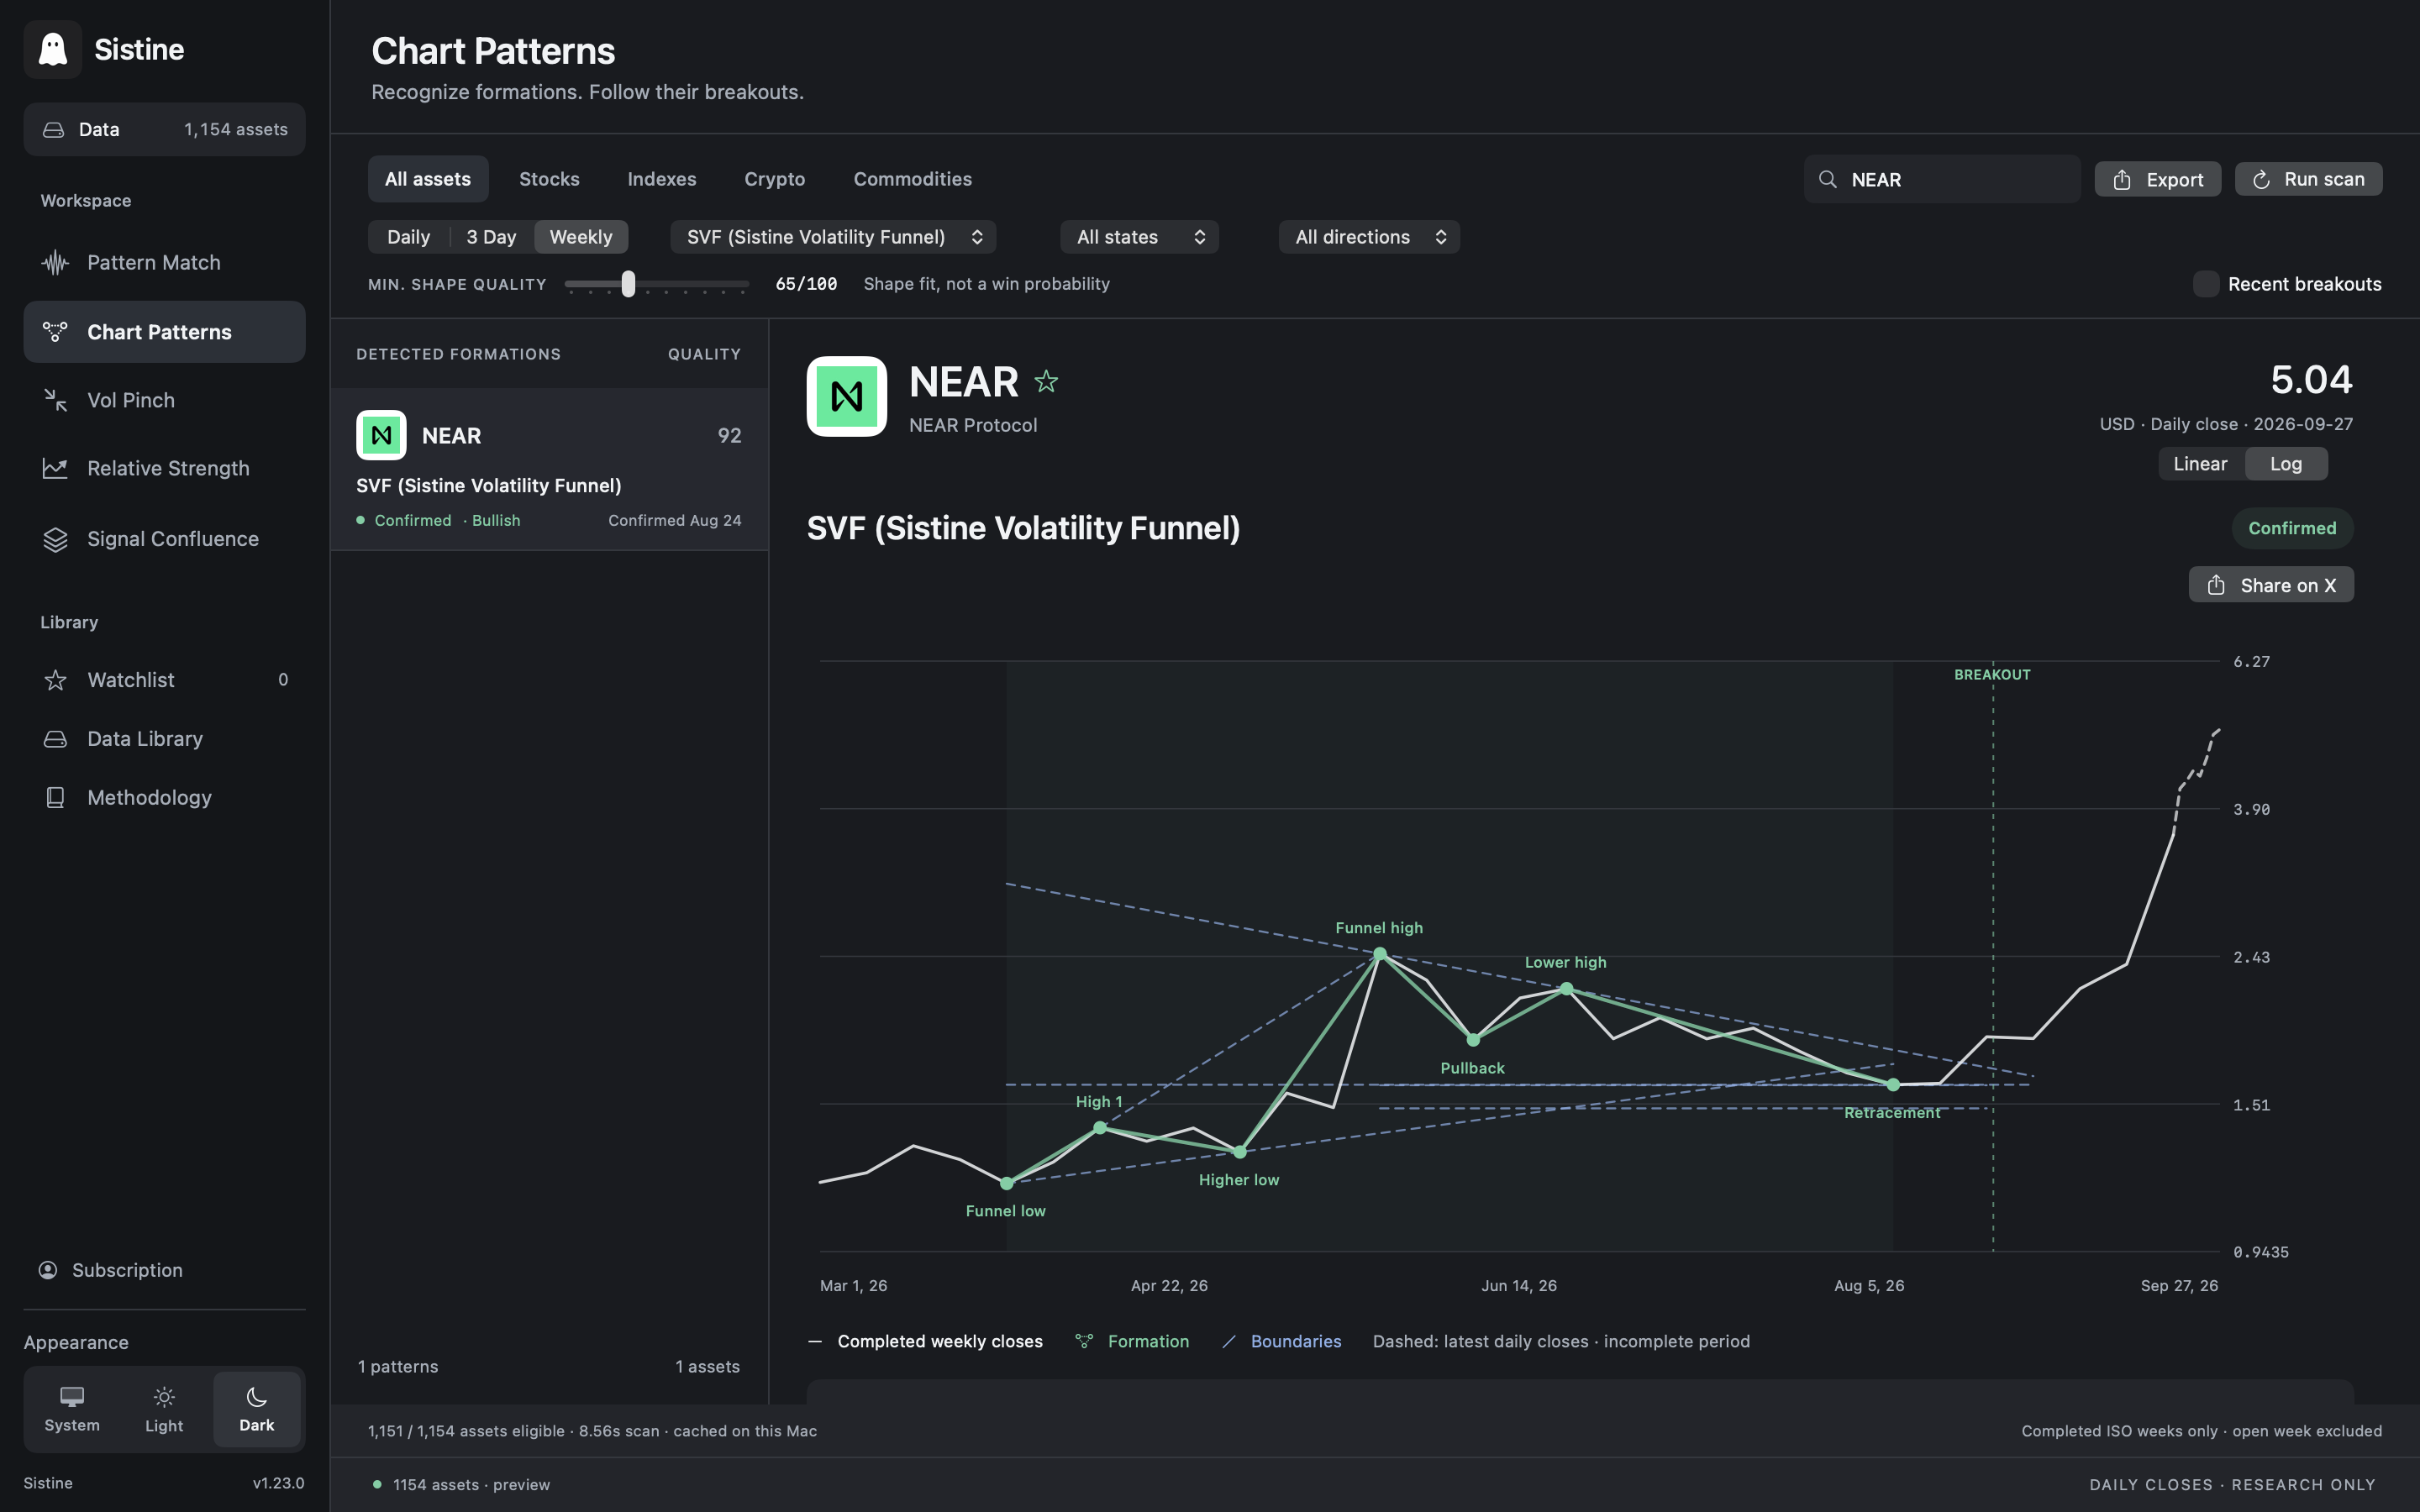
Core research uses completed daily observations. Chart Patterns offers Daily, 3 Day and Weekly views. Tops & Bottoms separately calculates Daily, Weekly and Monthly evidence. Onchain Coins uses its own hourly scan. Check each asset’s last available date; these are research snapshots rather than a live execution feed.
The web version works on Windows, Mac and phones. The native Mac app requires Apple silicon and macOS 14 or later. A core subscription includes the web version and one Mac. If you already paid and cannot get in, use access help before purchasing again.
Compare workflows in Sistine, TradingView, TrendSpider and Finviz. Choose the product whose data, controls and research process fit your needs.
Sistine combines seven research views in your browser and on Mac. The core plan is $9 USD per month; web, Mac and Telegram alerts together cost $12 per month total.
See plans and startAlready subscribed? Open SistineNo free trial. US customers only. Cancel future renewals anytime.